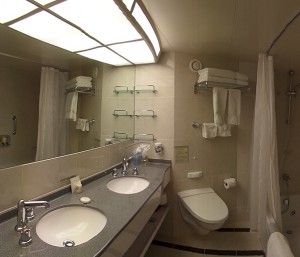
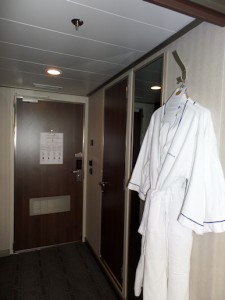
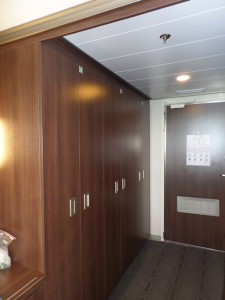
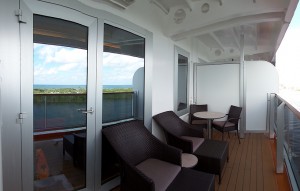
Here’s a little gallery of photos from Signature Suite #6080 on Holland America’s ms Nieuw Amsterdam. This stateroom is on Deck 6, on the port side of the ship. The photos were taken on November 16, 2014 using a Samsung WB800F Smart Camera. Several of the photos were taken using the camera’s built in panoramic mode to better capture the room.
Travel Thought of the Week
Living on Earth is expensive, but it does include a free trip around the sun every year.
Results Report: Holland America Balcony Smoking Survey
 The results are in! Thank you to the 334 survey respondents who made the Balcony Smoking Policy Attitudes Survey possible. From July 28th through August 1st, 2014 we surveyed hundreds of participants, calling on them to answer six questions regarding balcony smoking on the cruise ships of the Holland America Line. We will post a more comprehensive analysis of the results later in the week, but we wanted to make the survey report available as soon as possible.
To get your copy of the report in Adobe Acrobat format, simply click the image link below.
In order to keep the survey report as fair as possible, it is free from editorial content or interpretation. Don’t worry. There will be plenty of interpretation later, but for now the plain old results will have to suffice. If you have any questions regarding the survey, please feel free to contact us.
In America, there are two classes of travel – first class, and with children.
~ Robert Benchley
Slicing & Dicing the Data: Holland America Balcony Smoking Attitudes Survey
The National Institute’s survey of smoking attitudes wrapped up on Friday afternoon. By the time we finished collecting data, a total of 334 respondents participated in the survey. We are in the process of slicing and dicing the data now and hop to publish the results report later this week. Here’s a quick look at the makeup of the participant pool.
- Participants who consider themselves Holland America cruisers: 91%.
- 70% of the survey respondents have an upcoming cruise scheduled on Holland America. 30% do not.
- 53% of the people who took the survey identified themselves as non-smokers.
- 26% said that they were former smokers.
- Smokers accounted for 21% of the survey participants.
- The smoking/non-smoking percentages track very well with the percentages reported by the CDC, the American Lung Association, and other organizations.
Average Age of Balcony Smoking Poll Participants (Sample 1)
Every once in a while, you are doing a survey to measure one thing and you wind up getting some extra bonus information. I like to think of this as the “loose change in the seat cushions” of the survey world. In the case of the survey on attitudes about balcony smoking smoking on Holland America Lines’ cruise ships, we got some loose change in terms of the average age of the survey participants.
Bear in mind that this calculation was based on the first wave of survey respondents and that it is not an exact representation of the total Holland America demographic. It simply calculates the average age of the survey participants +/- 2.5 years. The demographic data was self reported, but we were only asking for an age range, not a specific age. The age range question method tends to get reasonably accurate responses. (An explanation of the methodology appears after the table.)
The average survey participant is about 58 1/2 years old.
| Age Group | Average | Percentage | Years |
|---|---|---|---|
| 21 – 30 | 25.5 | 1% | 0.255 |
| 31 – 40 | 35.5 | 3% | 1.065 |
| 41 – 50 | 45.5 | 12% | 5.340 |
| 51 – 60 | 55.5 | 34% | 18.870 |
| 61 – 70 | 65.5 | 41% | 26.855 |
| 71 – 80 | 75.5 | 8% | 6.040 |
| 81 – 90 | 85.5 | 0% | 0.000 |
| Average Age: | 58.425 |
Methodology: For each age range, we can make the assumption that the average person in the range is at the midpoint, or average age for the range. For example, for the 51 – 60 age group, you would take all 10 of the possible ages in the group and add them together.
(51 + 52 + 53 + 54 + 55 +56 + 57 + 58 +59 + 60) = 555
Divide that total (555) by the number of choices (10) and you get a midpoint/average age for the range of 555/10 = 55.5. It works the same for each range. These are the values you see in the 2nd column of the table.
The third column shows the percentage of respondents who were in that range. (This data comes from the Intermediate Readout Report for the Balcony Smoking survey here.) If we multiply the Average Age (Column 2) by the Percentage of respondents in that age bracket (Column 3), we get the number of years that particular bracket contributes to the total (Column 4.)
Add up the numbers in Column 4 and you get the Average Age of the participant. I stated the number as being within 2.5 years in either direction to account for potential error.


